
What is Business Intelligence? A Complete Guide for UK SMEs
🎯 Key Takeaway
The answer to what is business intelligence is that it is the process of using technology to analyse business data and present actionable information to help leaders make more informed decisions. For a UK Small and Medium-sized Enterprise (SME), it means turning sales figures, customer feedback, and operational data into a clear roadmap for growth. This guide provides a complete, no-nonsense breakdown for UK business leaders, showing how to move from guesswork to evidence-based strategy. Mastering Business Intelligence (BI) is the essential first step for any SME planning to use Artificial Intelligence (AI) effectively, as it creates the necessary data foundation.
Feeling buried under spreadsheets? Juggling data from your sales, marketing, and operations software without a clear picture of what’s actually working? You’re not alone. For many UK SME leaders, the term ‘business intelligence’ sounds like another piece of expensive, complex tech jargon reserved for large corporations. As of late 2026, however, understanding what is business intelligence is less about complex systems and more about gaining simple clarity. It’s the practical tool that translates the data you already have into straightforward answers. This guide demystifies BI, revealing its tangible value and its critical role as the practical AI infrastructure for future growth.
Written by: Up-Stride Content Team | Reviewed by: Mark Blake (Founder & CEO), Gabriel Imevbore (Client Experience & Sales), Thomas McElroy (Brand & Communications)
Expertise: Our team offers enterprise-ready AI guidance grounded in real C-suite and operational experience, specialising in making advanced technology accessible for UK SMEs.
Transparency Disclosure: This article explores business intelligence based on extensive industry research and our experience helping UK SMEs. Our goal is to empower you with clear, actionable information. Some links may connect to our human-centred AI strategy services. All information is editorially independent and verified for accuracy.
What is Business Intelligence (BI) in Simple Terms?
At its core, Business Intelligence (BI) is the process of transforming raw business data into understandable and actionable insights. Think of it as a smart translator for your company's numbers. You have data everywhere - in sales reports, accounting software, website analytics, and customer spreadsheets. On its own, this data is just noise. BI tools take that noise, clean it up, analyse it, and present it back to you in simple, visual formats like charts and dashboards.

The entire point of BI is to move your decision-making from ‘I think’ to ‘I know’. Instead of guessing which marketing campaign drove sales, a BI dashboard can show you. Instead of wondering why profits dipped last quarter, BI can help pinpoint the cause.
A key component of this is data visualisation, which refers to the graphical representation of information. It uses charts, graphs, and maps to make complex data sets easier for the human brain to understand and process. For an SME leader, this means you don't need to be a data scientist to spot a trend. A simple colour-coded map could instantly show your most profitable regions, or a line chart could reveal a seasonal dip in sales you can now prepare for. That's the power of BI: it makes your data speak plain English.
Why is Business Intelligence So Important for UK SMEs?
Business intelligence is so important for UK SMEs because it directly impacts the bottom line by improving productivity and reducing costly mistakes. In a competitive market, you can't afford to operate on gut feelings alone. BI provides the evidence needed to make smarter, faster, and more profitable decisions. The Confederation of British Industry (CBI) reports that over half of UK firms are now using AI and data tools, primarily driven by the need for improved productivity and cost reduction. For SMEs, this is not a luxury; it's a competitive necessity.
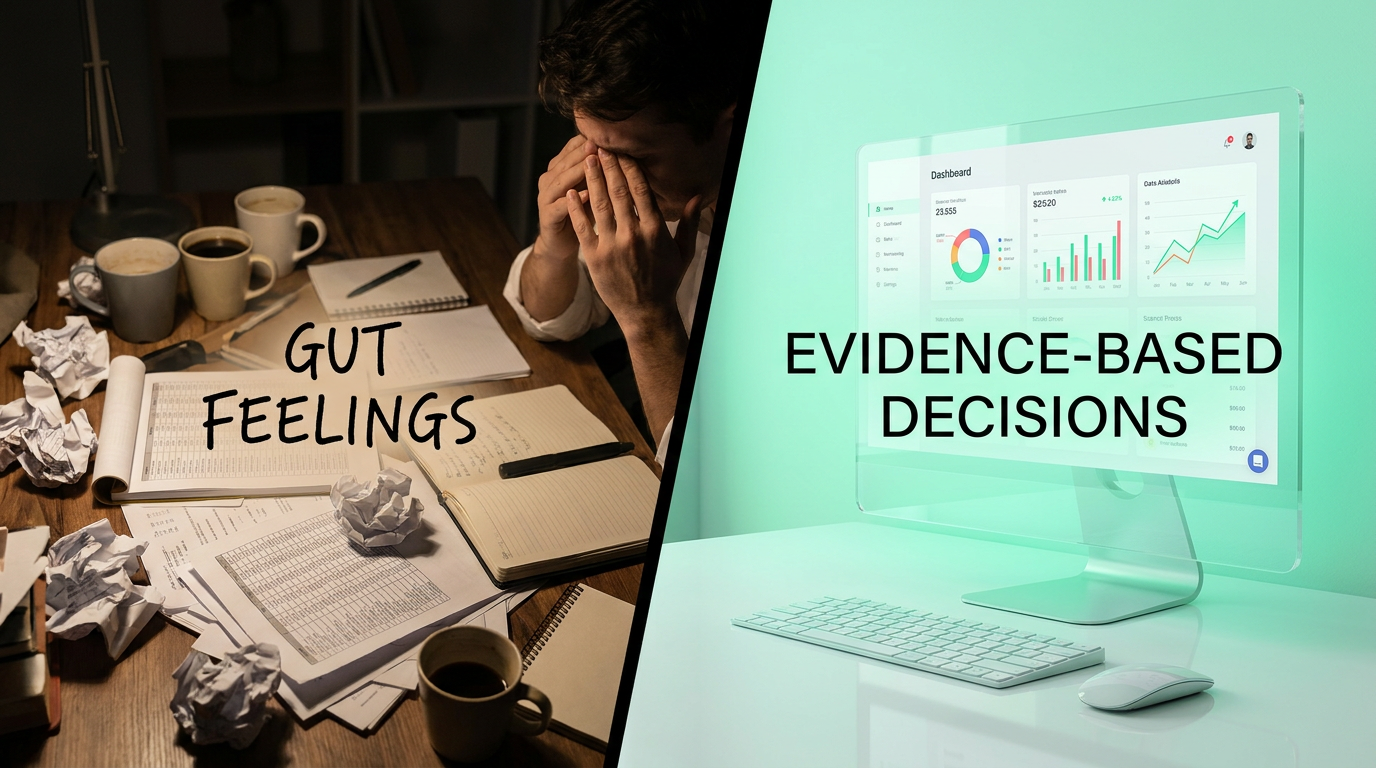
Here’s how it creates tangible value:
- Reduce Costs and Waste: BI helps you identify inefficiencies you might not see otherwise. Are you over-stocking a slow-moving product? Are certain delivery routes consistently costing you more in fuel and time? By visualising operational data, you can spot these money drains and take corrective action, directly boosting your profit margins.
- Improve Sales and Marketing Return on Investment (ROI): Which of your marketing channels actually bring in your most valuable customers? Where do your best clients live? BI connects your marketing spend to sales outcomes, allowing you to double down on what works and cut what doesn’t. This turns your marketing budget from an expense into a strategic investment.
- Enhance Customer Experience: By analysing customer data, you can understand purchasing patterns, identify common complaints, and even predict future needs. This allows you to provide better service, increase loyalty, and reduce churn. A happy customer is a repeat customer, and BI shows you the clearest path to creating them.
Ultimately, embracing BI closes the AI advantage gap between SMEs and their larger competitors by building a strong data foundation.
Real-World Business Intelligence Examples for British Businesses
The most effective way to understand BI is to see it in action. Here are some practical business intelligence examples tailored for UK SMEs:
- A Manchester-Based E-commerce Store: The owner uses BI software to connect to their Shopify data. A dashboard automatically shows them which postcodes generate the most sales. They discover a surprising hotspot in a London borough. They then use this insight to run a highly targeted social media ad campaign for that specific area, resulting in a 25% increase in sales from that region.
- A Logistics Firm in Birmingham: The operations manager was struggling with rising fuel costs. By implementing a simple BI tool to track driver routes, delivery times, and fuel consumption from vehicle telematics, they built a dashboard. It quickly became clear that two specific routes were consistently inefficient during rush hour. By adjusting schedules, they cut fuel costs by 8% within three months.
- A Small Professional Services Firm in London: The partners wanted to understand which services were truly profitable. They used BI to analyse project data from their accounting software, factoring in billable hours and overheads. The analysis revealed that their 'compliance package' had a much higher profit margin than their bespoke consulting work. This led them to restructure their service offerings and marketing, significantly improving overall profitability.
These scenarios show that BI isn't just for tech giants. It's a practical tool for automating your UK small business decisions.
### Case Study: Bristol-Based Subscription Box Co.
- Challenge: The company faced a high customer churn rate of around 12% per month, but they didn't understand why customers were cancelling. Their data was stuck in Stripe, their email platform, and spreadsheets, with no unified view.
- Solution: We helped them implement a BI dashboard connecting these data sources. Within days, they could visualise the entire customer journey, from acquisition source to cancellation reason.
- Results: The dashboard revealed that customers who skipped the onboarding survey were 40% more likely to cancel within two months. This led to a revamped onboarding process that reduced churn by 18% in the first quarter, saving an estimated £35,000 annually.
- Key Insight: BI doesn't just show you that you have a problem; it helps you discover why you have one, pointing directly to the solution.
Below is a comparison of some popular business intelligence tools for SMEs:
| Tool Name | Best For | Key Feature for SMEs | Typical UK SME Cost (per user/month) |
|---|---|---|---|
| Microsoft Power BI | Businesses already using the Microsoft 365 ecosystem. | smooth integration with Excel and other Microsoft products. Strong community support. | Free version available. Pro version starts around £8. |
| Tableau | Teams that prioritise powerful and intuitive data visualisation. | Best-in-class interactive dashboards that are easy to explore. | Viewer licences start around £12, with Creator licences being more. |
| Google Looker Studio | Start-ups and small businesses looking for a powerful, no-cost option. | Native integration with Google products (Analytics, Ads, Sheets). Fully free. | £0 |
| Qlik Sense | SMEs needing a reliable tool that can handle multiple complex data sources. | Associative Engine allows users to explore data in any direction. | Custom pricing, typically higher than entry-level tools. |
The 5 Stages of Business Intelligence: A No-Nonsense Breakdown
The process behind BI can sound technical, but it breaks down into five logical stages of business intelligence. Modern tools handle much of the heavy lifting, but understanding the workflow helps you appreciate what’s happening behind the scenes. Think of it as a recipe for turning raw ingredients (data) into a finished meal (insight).
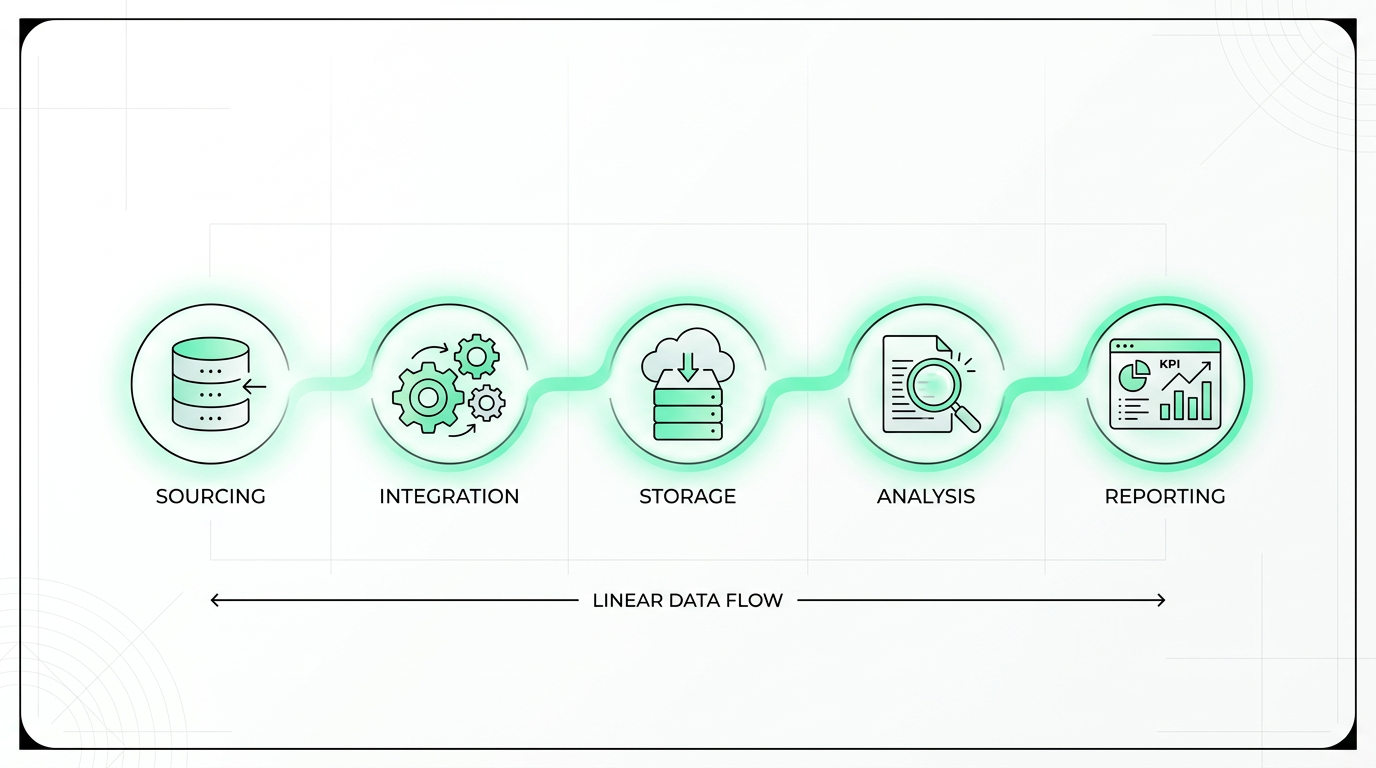
- Data Sourcing: This is the starting point - identifying and collecting data from its original location. For an SME, this could be your accounting software (like Xero), your Customer Relationship Management (CRM) system (like HubSpot), Google Analytics, or even simple Excel spreadsheets.
- Data Integration (ETL): This is where the magic starts. Data from different sources is often messy and inconsistent. The ETL process - which stands for Extract, Transform, Load - cleans it up. It extracts the data from its source, transforms it into a standard, clean format (e.g., ensuring dates are consistent), and loads it into a central repository.
- Data Storage: The cleaned-up data needs a home. This is often a Data Warehouse, which is a central database designed specifically for analysis and reporting. It acts as your company's 'single source of truth', ensuring everyone is working from the same reliable information.
- Data Analysis: With clean data in one place, analysts (or increasingly, AI-powered tools) can now query it to find patterns, trends, and anomalies. This is the stage where questions like "Which products are most frequently bought together?" are answered.
- Reporting & Visualisation: This is the final and most visible stage. The findings from the analysis are turned into easy-to-understand reports, dashboards, and charts. This is the interface you, the business leader, interact with to get your answers quickly and visually.
While this may seem like a lot, our Crawl, Walk, Run - AI Adoption Methodology simplifies it. We start with just one data source and one dashboard (Crawl) to deliver value fast, before expanding.
Business Intelligence vs AI: The Strategic Path for SMEs
Many business leaders use the terms Business Intelligence (BI) and Artificial Intelligence (AI) interchangeably, but they are distinct concepts with a crucial relationship. Understanding the difference is key to building a smart technology roadmap. The debate over business intelligence vs AI isn't about choosing one over the other; it's about sequencing them correctly.
At its simplest:
- Business Intelligence (BI) looks at past and present data to tell you what happened and why it happened. It is descriptive and diagnostic. It answers questions like, "What were our sales in Scotland last quarter?" and "Why did they increase after our last marketing campaign?"
- Artificial Intelligence (AI) uses that same data to predict what will happen and can even automate actions based on those predictions. It is predictive and prescriptive. It answers questions like, "What are our sales in Scotland likely to be next quarter?" and can even "Automatically adjust stock levels based on the sales forecast."
In our view, you must master BI before you can effectively command AI. A report from the UK's Department for Science, Innovation and Technology (2024) highlights that a 'lack of skilled staff' and poor data quality are major barriers to AI adoption. BI solves this by creating a clean, organised, and understood data foundation. It builds your organisation's "data muscle."
Trying to implement predictive AI without a solid BI foundation is like trying to build a house without laying the groundwork first - it’s unstable and likely to collapse. Our Crawl, Walk, Run - AI Adoption Methodology is built on this principle. BI is the 'Crawl' and 'Walk' phase: learning to understand your data and prove ROI. AI is the 'Run' phase: scaling those insights with predictive power and automation. You can explore more in our practical guide to AI implementation.
Important Considerations
While BI is a powerful tool, it's not a magic wand. Its effectiveness depends on the quality of the data you feed it - a concept known as 'garbage in, garbage out'. If your sales data is incomplete or your customer records are messy, your BI dashboards will reflect those inaccuracies. Furthermore, implementing a BI solution requires an investment of time and resources. There can be a learning curve for your team, and it requires a commitment to building a data-driven culture, not just buying software.
For very small businesses with simple data needs, a well-organised system of spreadsheets can sometimes serve as a basic, no-cost alternative for tracking key metrics. At the other end of the spectrum, large enterprises might invest in full-scale data science teams and custom analytics platforms, which is often overkill for a typical SME. The key is finding the right-sized solution for your current needs and future ambitions.
We recommend you consider professional guidance when your data is spread across multiple, complex systems, when you aren't confident in your team's ability to ensure data quality, or when your goal is to move from historical analysis to predictive AI. A strategic partner can help you build a scalable BI foundation that aligns with your long-term business goals, helps you avoid costly mistakes, and ensures you get a return on your investment quickly.
Frequently Asked Questions
What is business intelligence?
Business Intelligence (BI) is the process of using software and services to turn data into actionable insights that drive business decisions. It involves collecting, analysing, and visualising historical and current data to give you a clear picture of your business's performance. In essence, understanding what is business intelligence is about using facts, not feelings, to guide your strategy and operations.
Why is business intelligence important?
Business intelligence is important because it replaces guesswork with evidence-based decision-making, giving you a significant competitive advantage. This data-driven approach leads to reduced operational costs, improved efficiency, and more effective sales and marketing campaigns. Without BI, businesses risk making costly mistakes based on flawed assumptions about their customers and operations.
What are the 5 stages of business intelligence?
The five main stages of business intelligence are data sourcing, integration (ETL), storage, analysis, and reporting. This sequence involves gathering raw data from various systems, cleaning and organising it, storing it in a central data warehouse, using analytical tools to find patterns, and finally presenting those findings in visual dashboards and reports for business leaders to use.
Can you give me an example of business intelligence?
A common business intelligence example is a retail manager using a sales dashboard to see which products are selling best by region and time of day. This insight allows them to adjust stock levels in specific stores, optimise staff schedules for peak hours, and create targeted promotions. This same principle can be applied to any department, from finance and operations to marketing and HR.
What are the top 3 business intelligence tools?
Three of the top business intelligence tools for SMEs are Microsoft Power BI, Tableau, and Google Looker Studio. Power BI integrates smoothly with the Microsoft ecosystem, Tableau is renowned for its powerful and intuitive visualisations, and Looker Studio is an excellent free option for those using Google products. The 'best' tool ultimately depends on your specific budget, existing systems, and technical skill level.
What are types of business intelligence?
The main types of business intelligence include descriptive analytics, diagnostic analytics, and performance management. Descriptive analytics shows what happened (e.g., a monthly sales report), while diagnostic analytics helps explain why it happened (e.g., drilling down to see that a sales dip was caused by a competitor's promotion). These are often combined in modern BI dashboards to provide a comprehensive view of performance.
Is business intelligence the same as ETL?
No, business intelligence is not the same as ETL, but ETL is a crucial part of the BI process. ETL (Extract, Transform, Load) is the technical, back-end process of collecting data from various sources, cleaning it, and loading it into a data warehouse. BI is the broader discipline of using that prepared data for analysis and strategic decision-making. ETL is a foundational step that makes effective BI possible.
Will AI replace business intelligence analysts?
AI is unlikely to replace business intelligence analysts but will significantly evolve their role. AI can automate the generation of routine reports and dashboards, freeing up analysts to focus on more strategic work. This includes interpreting complex results, asking more sophisticated questions of the data, and acting as strategic advisors to business leaders. The role is shifting from report builder to insight translator.
What is business intelligence as a skill?
Business intelligence as a skill is the ability to analyse data and communicate insights effectively to drive better business decisions. It's a hybrid skill set, combining technical capabilities (like using BI tools and understanding data models) with crucial soft skills (like critical thinking, problem-solving, and storytelling with data). It is a highly valuable skill across many modern business roles, not just for dedicated analysts.
What are the four pillars of business intelligence?
The four pillars of business intelligence are often considered to be data warehousing, analytics, reporting, and performance management. This framework covers the entire process: securely storing data (warehousing), examining it for insights (analytics), sharing those findings through dashboards (reporting), and using them to track Key Performance Indicators or KPIs (performance management). This provides a structured way to think about a complete BI system.
From Insight to Action: Making Your Business Smarter
Ultimately, understanding what is business intelligence is the first step towards transforming your SME into a smarter, more agile organisation. It is not an intimidating enterprise technology but a practical set of tools and processes for turning the data you already have into your most valuable asset. By embracing data-driven decision-making, you close the competitive gap, build the essential foundation needed to operate effectively today, and prepare your business for the opportunities of AI tomorrow.
If you're ready to move from data confusion to data clarity, the journey starts here. At Up-Stride, we specialise in creating human-centred AI and data strategies for UK SMEs. Our Crawl, Walk, Run - AI Adoption Methodology ensures you get immediate value without being overwhelmed. We can help you build a practical AI infrastructure that delivers results and paves the way for future growth. Book a free, no-obligation consultation to discuss your business goals.
References
- Department for Science, Innovation and Technology (GOV.UK) (2024) - Government Report. This report estimates the UK AI market size and identifies 'lack of skilled staff' as a key barrier to AI implementation for businesses.
- UK Government (2021) - Government Strategy Paper. This paper details the UK's 10-year plan to support the AI ecosystem.
- Information Commissioner's Office (ICO) - Regulatory Guidance. Provides official guidance on how to comply with UK GDPR when using data for analytics.
- Stanford Institute for Human-Centered Artificial Intelligence (HAI) - Academic Index Report. The annual AI Index Report tracks global trends in corporate AI investment and capabilities.
- Organisation for Economic Co-operation and Development (OECD) - International Body Policy Observatory. Provides international principles for trustworthy AI.
- Innovate UK (2023) - Government Agency Report. This report details opportunities for UK service sector businesses to use AI to improve productivity.
- The Alan Turing Institute - National Institute Research Report. This report explains AI's potential to boost the UK economy and the challenges for businesses.
- World Economic Forum (2023) - International Organisation Report. This report notes that 75% of companies surveyed are looking to adopt AI.
- Confederation of British Industry (CBI) - Professional Organisation Survey. Reveals that over half of UK firms are using AI, driven by desires for improved productivity.
- Tableau - Industry Guide. Provides an overview of BI as an umbrella term for the data management and analysis that generates actionable insights.
- Qlik - Industry Guide. Defines BI as a combination of strategies and technologies for analysing business information and transforming data.
- Databricks - Industry Guide. Explains how BI platforms are evolving to include AI capabilities for more advanced analytics.
From Insight to Action: Making Your Business Smarter
In summary, what is business intelligence is the first step towards transforming your SME into a smarter, more agile organisation. It is not an intimidating enterprise technology, but a practical set of tools and processes for turning the data you already have into your most valuable asset. By moving from guesswork to evidence-based insights, you can optimise operations, enhance customer satisfaction, and uncover new growth opportunities. The journey from BI vs AI is a clear path: mastering BI builds the essential data foundation needed to compete effectively today and prepare for the opportunities of Artificial Intelligence tomorrow.
If you're ready to move from data confusion to data clarity, the journey starts here. At Up-Stride, we specialise in creating human-centred AI and data
strategies for UK SMEs. We can help you build a practical BI framework that delivers immediate value and paves the way for future growth. Book a free, no-obligation consultation to discuss your business goals.